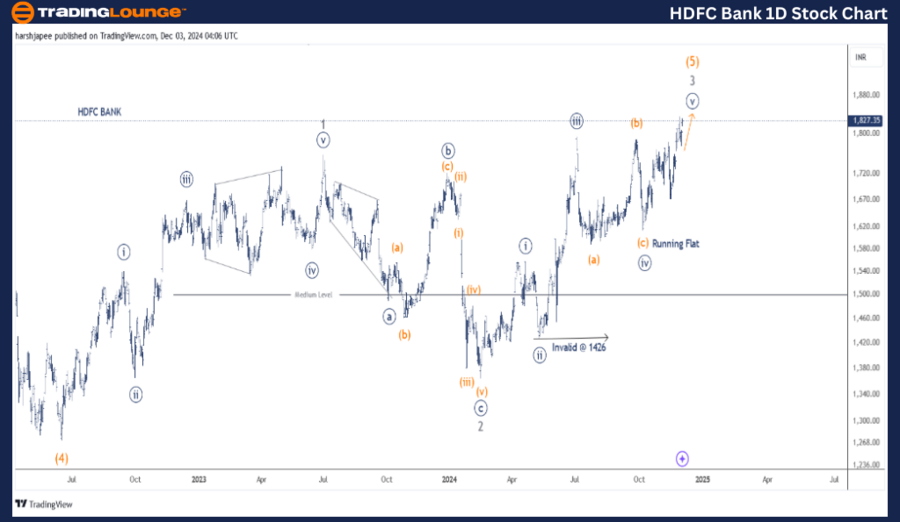
HDFC Bank (one day chart) Elliott Wave technical analysis
Function: Larger Degree Trend Higher (Intermediate degree, orange).
Mode: Motive.
Structure: Impulse.
Position: Minute Wave ((iv)) Navy Flat.
Details: Minute Wave ((v)) Navy, is now progressing higher within Minor Wave 3 Grey of Intermediate Wave (5) Orange against 1426. No change.
Invalidation point: 1426.
HDFC BANK daily chart technical analysis and potential Elliott Wave counts:
HDFC BANK daily chart is indicating a progressive rally, which is within Minor Wave 3 Grey of Intermediate Wave (5) Orange against 1426 mark. The stock has closed above 1800 mark and could accelerate as immediate resistance around 1795 has been taken out.
The stock…

